Ads, store, e-mail and sales spreadsheet read together, on a single screen.
Sinal · interface study
Fewer spreadsheets,
more decisions.
A marketing dashboard study that brings spend, sales and audience onto a single screen and starts with what changed this week, in plain language.
See the screens
In-house study
by Matheus Andrade
by Matheus Andrade
01The problem
The numbers exist.
The insight is not.
Whoever handles marketing for a small company opens the ads manager, the store, the e-mail tool and a spreadsheet, and still reaches Monday not knowing what worked. Sinal is a study of how to answer that on a single screen.
Everything in reais: how much came in for each real invested, not just clicks and likes.
What changed comes before the charts, with the likely reason and the next action.
02Inside Sinal / Interface studies
Four screens,
four questions.
How am I doing? Where do I put the next real? Who is buying? What changed? Each screen answers one question.
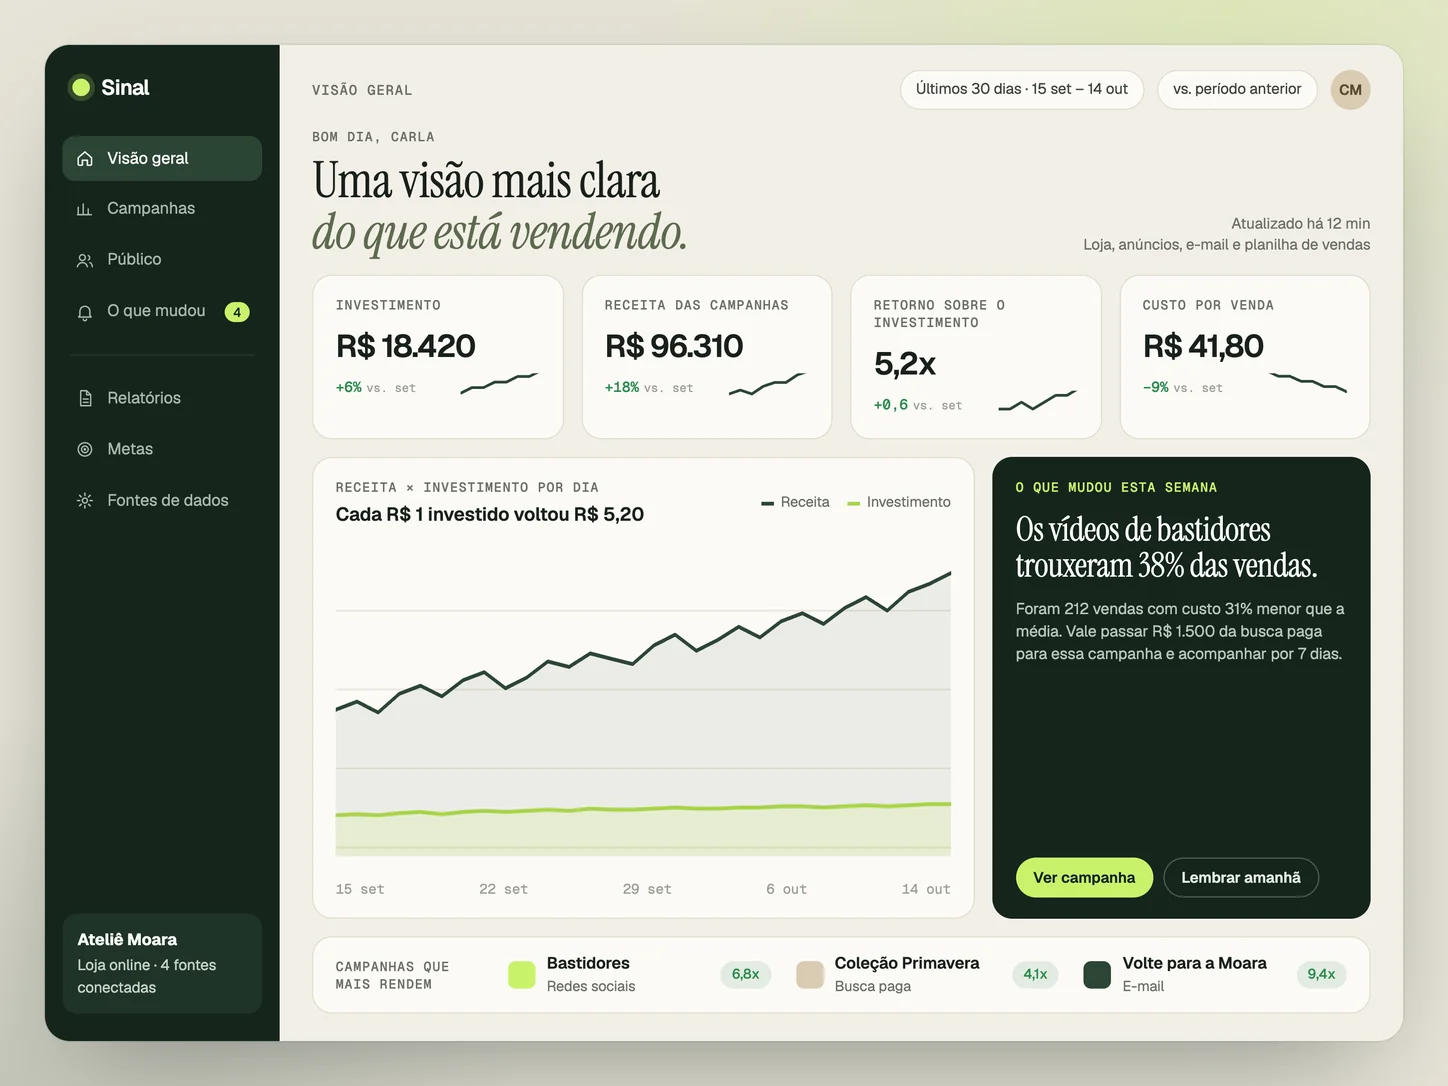
How I'm doing, in five seconds.
Four numbers compared with the previous month, revenue next to spend and, highlighted, the change that matters most this week.
Design study · Fictional data · Click to enlarge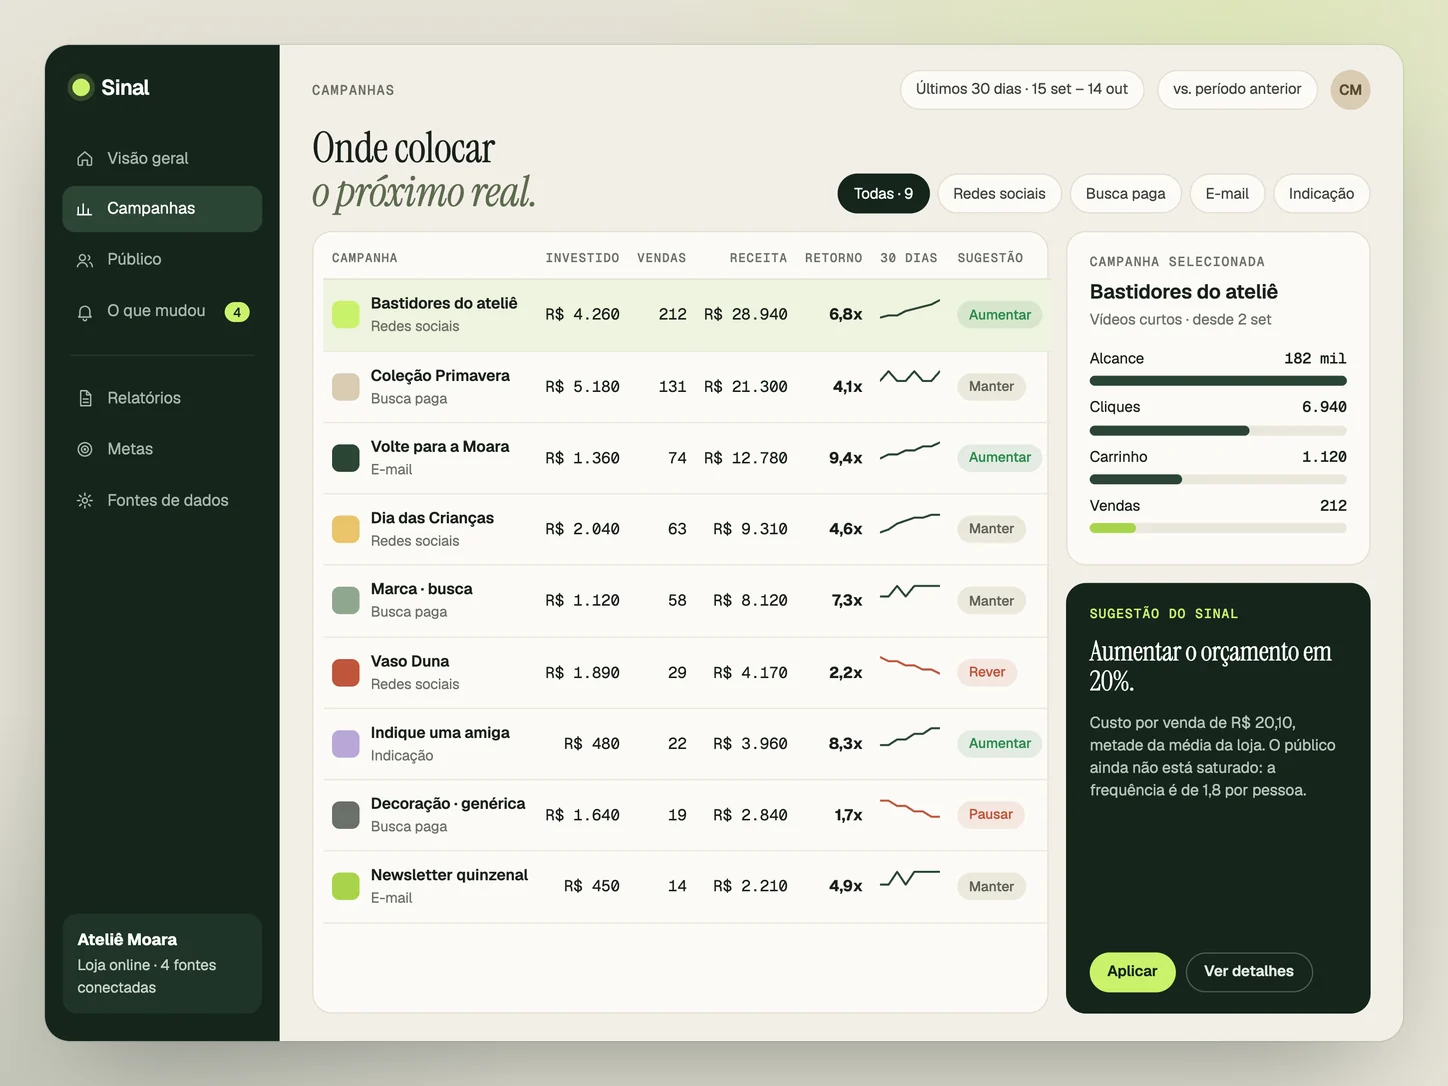
Where to put the next real.
Each campaign with spend, sales, revenue and return, and a direct suggestion: increase, keep, review or pause. The funnel shows where people drop off.
Design study · Fictional data · Click to enlarge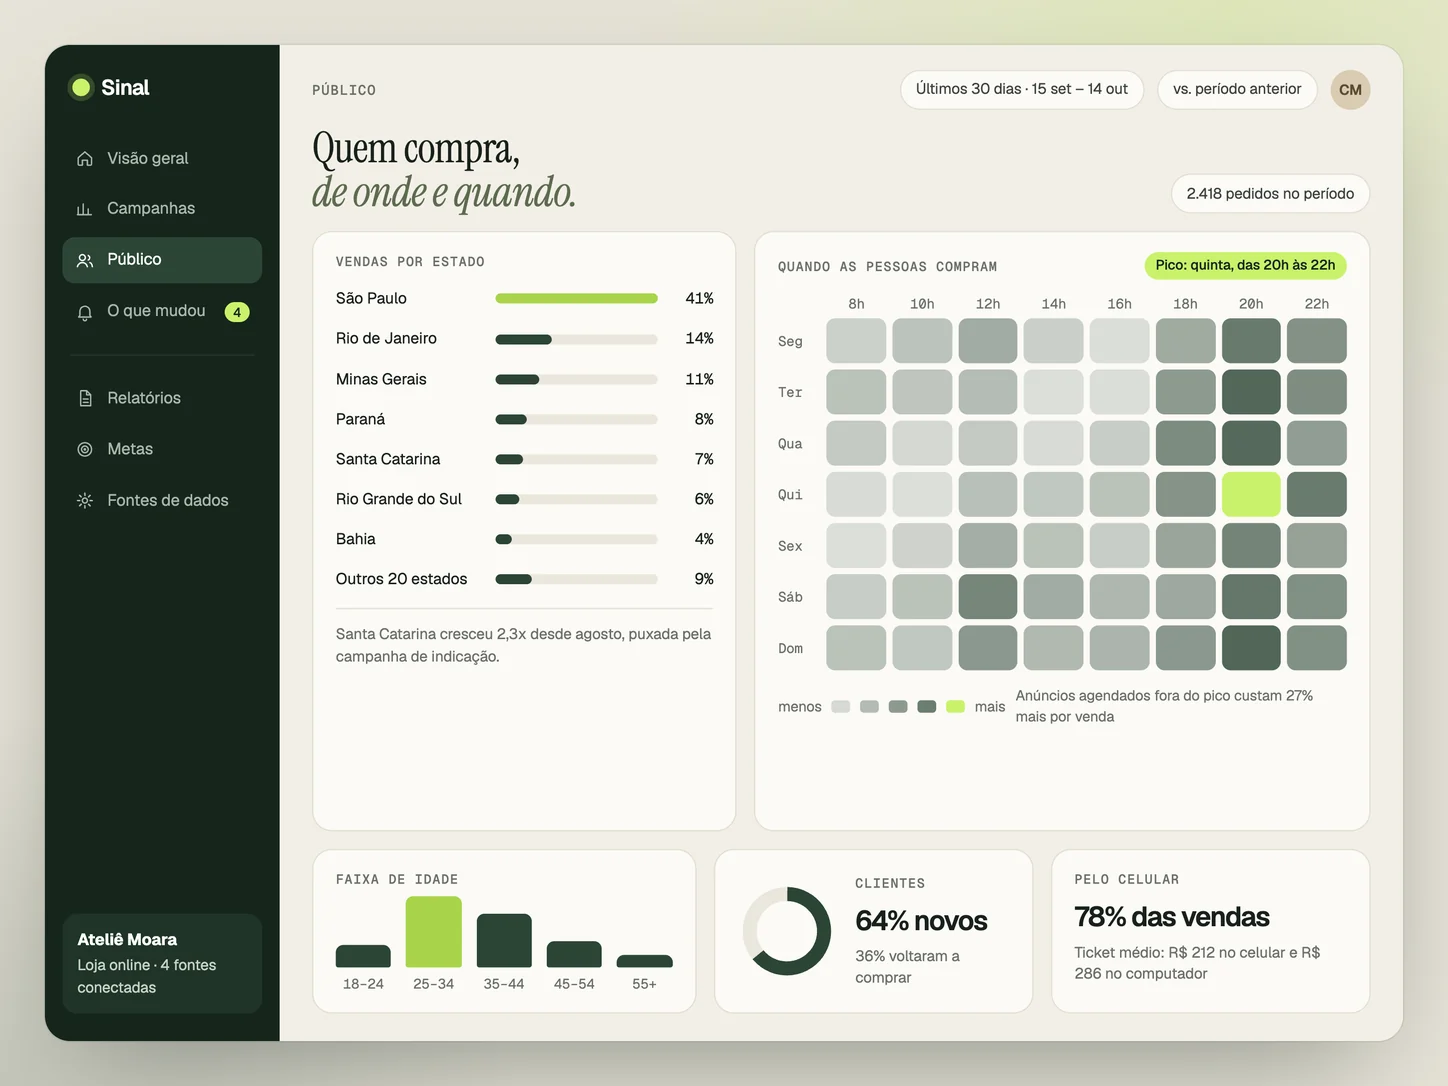
Who buys, from where and when.
Sales by state, peak hours, age and how much comes from mobile. Enough to schedule ads and choose where to invest.
Design study · Fictional data · Click to enlarge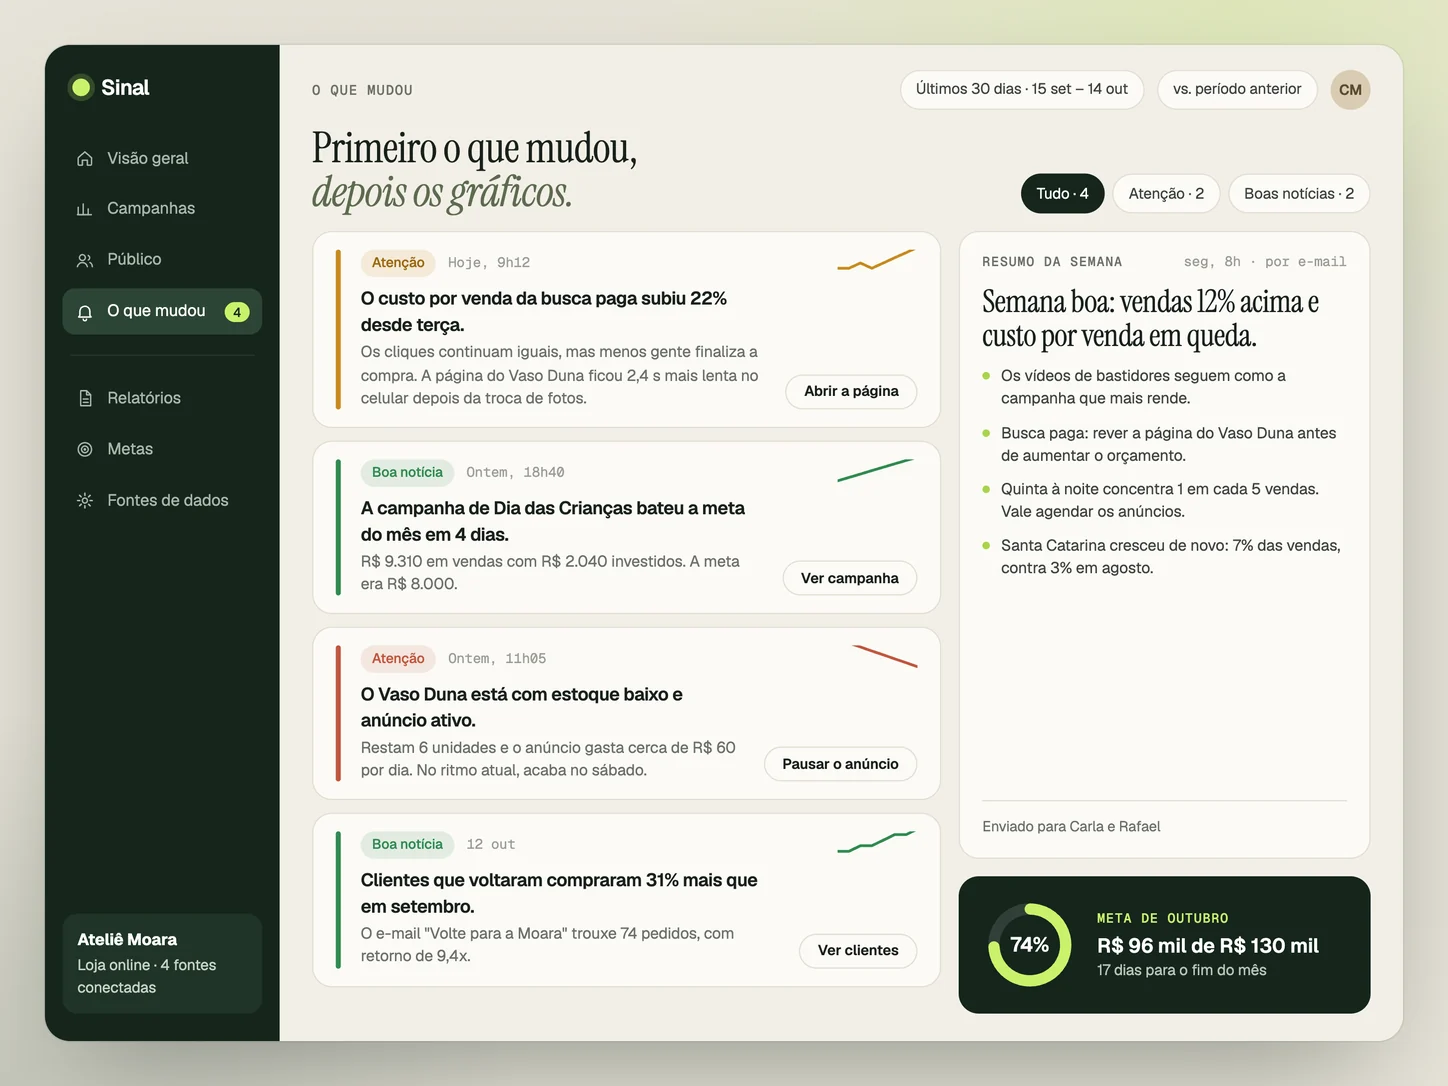
What changed, first.
Alerts written the way a person would write them, with the likely reason and the next action. Every Monday, a weekly summary arrives by e-mail.
Design study · Fictional data · Click to enlargeAteliê Moara, the people, the campaigns and all numbers are fictional. The screens are an interface study, not a product in operation or client results.
03How Sinal thinks
Three rules
of the study.
Design decisions that apply to any data dashboard I build.
One question per screen.
Each screen exists to answer an everyday question. If a chart does not help answer it, it goes.
QuestionAnswer
What changed comes first.
Before the charts, the dashboard says what went up, what went down and why. A number that stands still does not ask for attention.
ChangeReasonNext action
In reais, not in likes.
Spend, revenue, return and cost per sale. Reach and clicks show up when they help explain a sale.
ClicksSalesRevenue
04Transparency / Study status
What it is
and what it is not.
Sinal is an interface study. Here is what actually exists.
Design
Four screens, the hierarchy of the metrics and the text of the alerts, designed for the routine of a small online store. There is no code or real data behind these screens.
Data
The next step would be to connect real sources, such as ads, store, e-mail and spreadsheets, and validate with small companies what they look at every week.

Data dashboards
Want a dashboard like this
at your company?
Sinal is a study, but custom dashboards are part of the services: bringing together the data you already have and showing what deserves attention. Tell me which numbers you track today.
Want to see a delivered project? Explore the Oikos case